Support center
Provide you with comprehensive product operation guidelines
End User
1. Device Widget
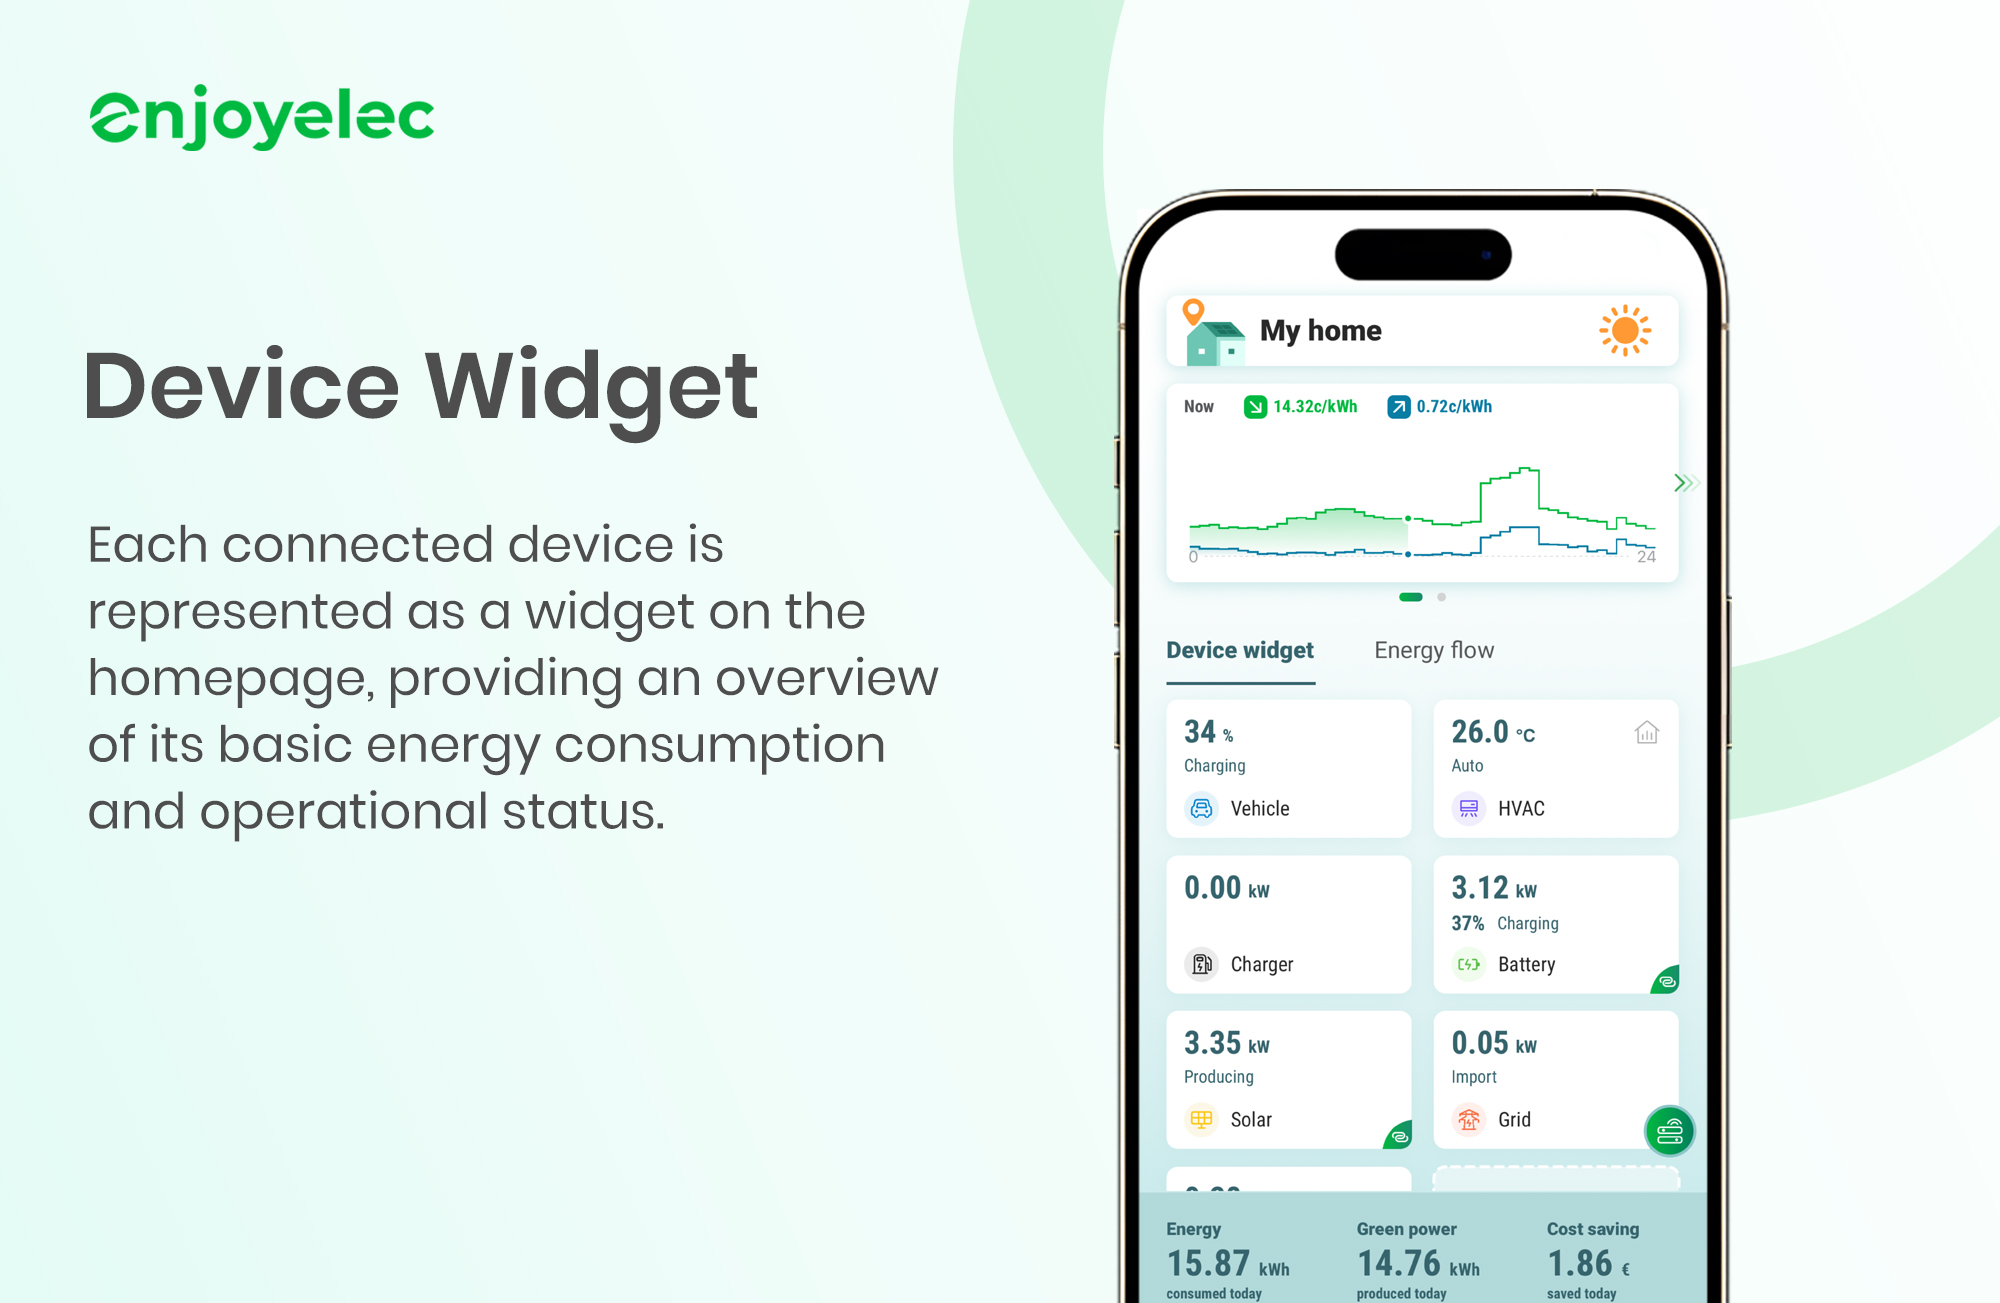
Each connected device is represented as a widget on the homepage, providing an overview of its basic energy consumption and operational status.
· Displayed Information: Each added device is showcased as a card on the homepage, providing quick access to essential information and functionality.
- Basic Energy Consumption & Status: The card displays the device’s basic energy consumption data and current operational status.
- Clickable Interface: Tapping on a device card leads to a detailed view where users can access specific information and perform device-related settings.
· Supported Device Types:
- Solar: Power at 0 indicates standby mode; non-zero power with “producing” status means the device is operational.
- Battery: Zero power signifies standby; non-zero power indicates operation with states of “charging” or “discharging,” accompanied by a percentage indicating SOC.
- Electric Vehicles (EVs): Percentage displays remaining battery charge, with states including “idle,” “plugged,” “charging,” and “discharging.”
- Charger: Displays current charging power and status (idle, plugged, charging, discharging, smart charging, finished, unconnected, fault, unavailable).
- Grid: Zero power indicates standby (No electricity from the grid at home); non-zero power is categorized as “import” or “export.”
- HVAC : “Off” indicates the system is turned off, with operational modes including “auto,” “heat,” “cool,” and no mode specified.

2. Energy Flow
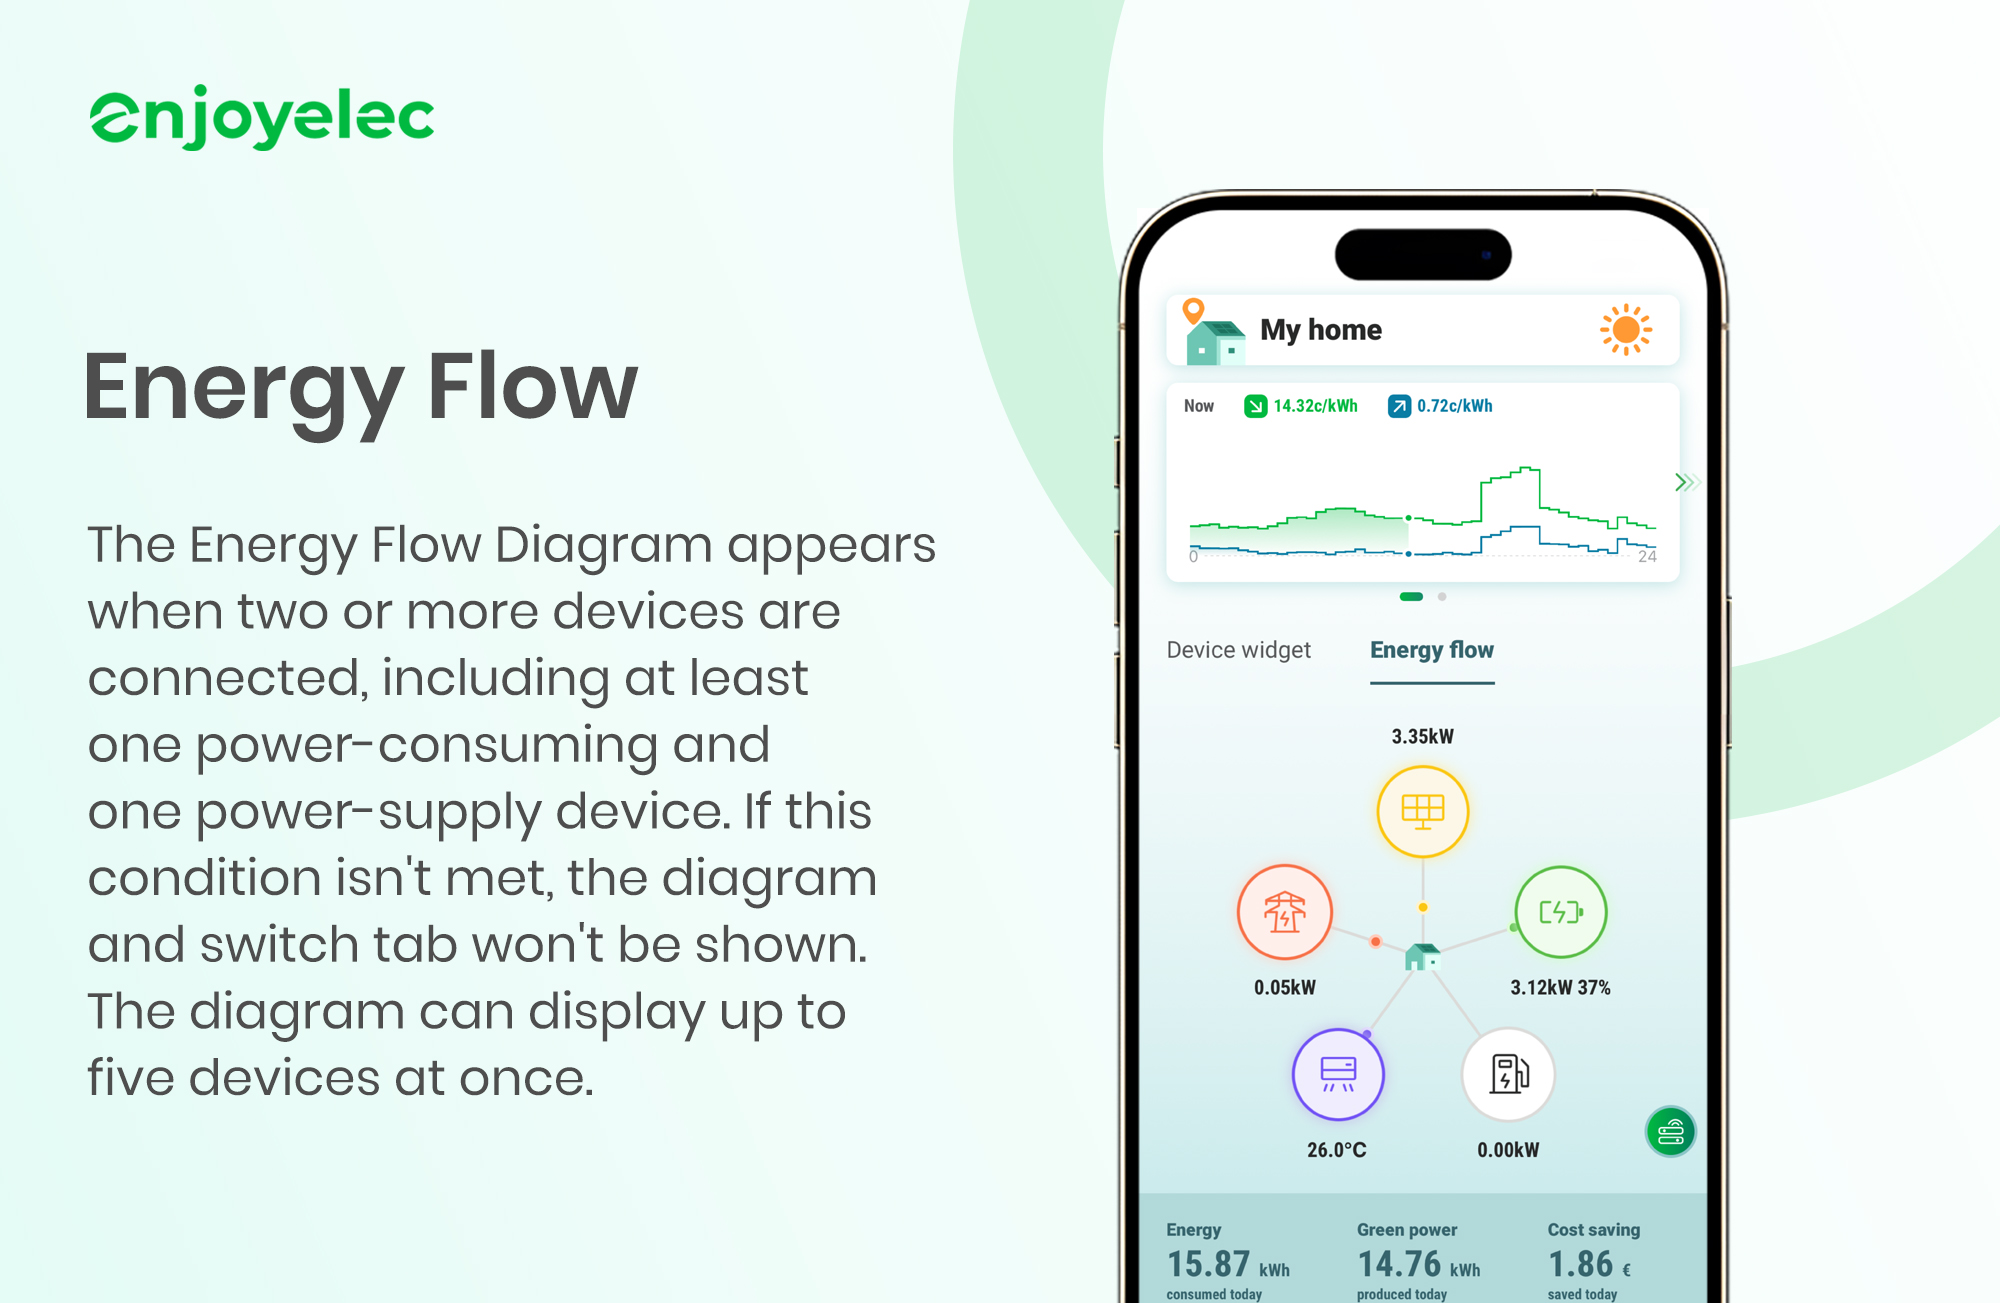
Accessible by tapping the “Energy Flow” button on the homepage. The Energy Flow Diagram provides a visual representation of energy flow within the system, enhancing user understanding and enabling informed device management.
Display condition:
- The Energy Flow Diagram is shown when two or more types of devices are bound, with at least one power-consuming device (Battery, HVAC, Charger) and a power-supply device (Grid, PV, Battery). If this condition is not met, the Energy Flow Diagram and the switch tab will not be displayed. The diagram can display up to five devices at once.
Features:
- Clear Energy Flow Visualization: The diagram illustrates the current flow of energy, allowing users to intuitively monitor energy usage and adjust device settings accordingly.
- Colored Dots & Arrows: The movement of colored dots along connecting lines represents the direction of energy flow.
- Grayed-Out Icons: Icons appear gray when the corresponding device is not actively contributing to or consuming energy. Clicking on these grayed-out icons allows you to bind the device.
- Interactivity: Tapping on a device icon within the Energy Flow Diagram has the same effect as tapping on its respective device card, enabling users to view detailed information and settings.

